Conversation
Screenshot ChangesBase: Changed (36)
|
| Before | After |
|---|---|
 |
 |
sessions/aiCustomizationShortcutsWidget/WithMcpServers/Light
| Before | After |
|---|---|
 |
 |
sessions/aiCustomizationShortcutsWidget/WithCounts/Light
| Before | After |
|---|---|
 |
 |
chat/aiStats/AiStatsHover/Light
| Before | After |
|---|---|
 |
 |
sessions/aiCustomizationShortcutsWidget/Expanded/Dark
| Before | After |
|---|---|
 |
 |
sessions/aiCustomizationShortcutsWidget/WithMcpServers/Dark
| Before | After |
|---|---|
 |
 |
sessions/aiCustomizationShortcutsWidget/WithCounts/Dark
| Before | After |
|---|---|
 |
 |
chat/aiStats/AiStatsHover/Dark
| Before | After |
|---|---|
 |
 |
chat/artifacts/chatArtifacts/MultiSourceExpanded/Dark
| Before | After |
|---|---|
 |
 |
chat/aiCustomizations/aiCustomizationListWidget/InstructionsTabWithItems/Light
| Before | After |
|---|---|
 |
 |
chat/aiCustomizations/aiCustomizationManagementEditor/WelcomePage/Light
| Before | After |
|---|---|
 |
 |
chat/aiCustomizations/aiCustomizationManagementEditor/Sessions/Light
| Before | After |
|---|---|
 |
 |
chat/aiCustomizations/aiCustomizationManagementEditor/SessionsSkillsTab/Light
| Before | After |
|---|---|
 |
 |
chat/aiCustomizations/aiCustomizationManagementEditor/HooksTab/Light
| Before | After |
|---|---|
 |
 |
chat/aiCustomizations/aiCustomizationListWidget/InstructionsTabWithItems/Dark
| Before | After |
|---|---|
 |
 |
chat/aiCustomizations/aiCustomizationManagementEditor/WelcomePage/Dark
| Before | After |
|---|---|
 |
 |
chat/aiCustomizations/aiCustomizationManagementEditor/Sessions/Dark
| Before | After |
|---|---|
 |
 |
chat/aiCustomizations/aiCustomizationManagementEditor/SessionsSkillsTab/Dark
| Before | After |
|---|---|
 |
 |
chat/aiCustomizations/aiCustomizationManagementEditor/HooksTab/Dark
| Before | After |
|---|---|
 |
 |
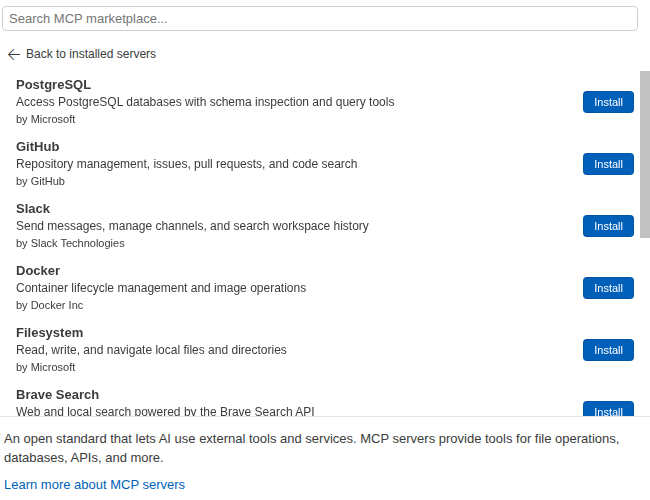
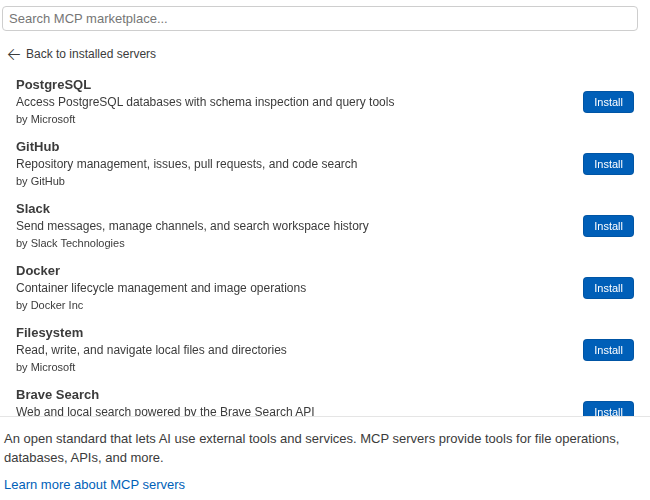
chat/aiCustomizations/aiCustomizationManagementEditor/McpBrowseMode/Dark
| Before | After |
|---|---|
 |
 |
chat/aiCustomizations/aiCustomizationManagementEditor/McpBrowseMode/Light
| Before | After |
|---|---|
 |
 |
chat/aiCustomizations/aiCustomizationWelcomePages/WelcomePagePromptLaunchers/Light
| Before | After |
|---|---|
 |
 |
chat/aiCustomizations/aiCustomizationWelcomePages/WelcomePageSelectorPromptLaunchers/Light
| Before | After |
|---|---|
|
|
chat/aiCustomizations/aiCustomizationWelcomePages/WelcomePagePromptLaunchers/Dark
| Before | After |
|---|---|
 |
 |
chat/aiCustomizations/aiCustomizationWelcomePages/WelcomePageSelectorPromptLaunchers/Dark
| Before | After |
|---|---|
|
|
editor/inlineCompletions/other/JumpToHint/Dark
| Before | After |
|---|---|
 |
 |
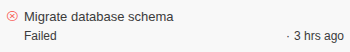
agentSessionsViewer/FailedWithoutDuration/Dark
| Before | After |
|---|---|
 |
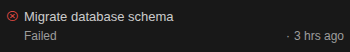 |
agentSessionsViewer/FailedWithoutDuration/Light
| Before | After |
|---|---|
 |
 |
agentSessionsViewer/WithBadge/Light
| Before | After |
|---|---|
 |
 |
agentSessionsViewer/WithMarkdownBadge/Light
| Before | After |
|---|---|
 |
 |
agentSessionsViewer/WithBadgeAndDiff/Light
| Before | After |
|---|---|
 |
 |
agentSessionsViewer/ClaudeProvider/Light
| Before | After |
|---|---|
 |
 |
agentSessionsViewer/WithBadge/Dark
| Before | After |
|---|---|
 |
 |
agentSessionsViewer/WithMarkdownBadge/Dark
| Before | After |
|---|---|
 |
 |
agentSessionsViewer/WithBadgeAndDiff/Dark
| Before | After |
|---|---|
 |
 |
agentSessionsViewer/ClaudeProvider/Dark
| Before | After |
|---|---|
 |
 |
There was a problem hiding this comment.
Pull request overview
Adds a new chat-focused performance benchmarking harness to the repository, including a CI workflow for comparing baseline vs test builds. This fits into the existing scripts/ perf tooling by providing repeatable end-to-end chat timing/rendering/memory measurements backed by a deterministic mock LLM server.
Changes:
- Introduce chat perf regression runner + leak checker scripts under
scripts/chat-perf/(Playwright + CDP-based metrics). - Add a local mock LLM server and shared utilities for build resolution, launch args/env, and statistical comparison.
- Wire up npm scripts, CI workflow, and documentation for running these benchmarks.
Show a summary per file
| File | Description |
|---|---|
| scripts/chat-perf/test-chat-perf-regression.js | Runs scenario-based chat perf benchmarks and compares against a baseline build. |
| scripts/chat-perf/test-chat-mem-leaks.js | Sends repeated chat messages in one session and detects monotonic heap/DOM growth. |
| scripts/chat-perf/common/utils.js | Shared helpers for build download/launch configuration and statistics. |
| scripts/chat-perf/common/mock-llm-server.js | Local deterministic streaming server that emulates Copilot/OpenAI-style endpoints. |
| package.json | Adds perf:chat and perf:chat-leak npm entry points. |
| .gitignore | Ignores .chat-perf-data output directory. |
| .github/workflows/chat-perf.yml | Adds a manual workflow to compare baseline vs test build performance and publish artifacts/summary. |
| .github/skills/chat-perf/SKILL.md | Documents how to run the new perf and leak tools and interpret results. |
Copilot's findings
- Files reviewed: 7/8 changed files
- Comments generated: 8
| try { await cdp.send('Tracing.end'); await new Promise(r => setTimeout(r, 200)); } catch { } | ||
| await cdp.send('Tracing.start', { | ||
| traceConfig: { | ||
| includedCategories: ['v8.gc', 'devtools.timeline'], |
There was a problem hiding this comment.
Whats the reason behind not using the existing trace infra in the runtime ? --enable-tracing and --trace-startup-file. Our current startup perf module relies on it to extract relevant category details https://github.com/microsoft/vscode-perf/blob/9c76748df860a2cd54396fc437a78b4ab2b7c79a/src/perf.ts#L175-L186 for example.
You could extract the heap usages (from gc metrics), cpu samples, perf markers from a unified trace instead of injecting process global performance observers right ?
No description provided.